
Experimental stations
The Photoelectric Effect
The photoelectric effect is all about kicking electrons out of metals, using light.
When the light strikes the metal, its energy is transferred to the electrons. Different wavelengths (or colours) of light carry different amounts energy. If the light has a high enough energy, the electrons will escape from the surface of the material. If the energy of the light is too low, then it will not. Thus there is a threshold of energy needed for the metal to lose an electron, and this threshold is different for different materials.
To investigate this phenomena, you will be using the following pieces of equipment:
- Light sources: a set of six LED’s (light emitting diodes) of various colours, with known wavelengths. The wavelength can be used to calculate the energy carried by the light.
- Electron emitter: this is the metal target, a photocathode that emits electrons when hit light of high enough energy.
- Electron collector: a capacitor, which will collect the electrons ejected from the photocathode.
When we shine light on the metal (photocathode), we need some way of detecting when electrons are emitted. In this experiment, a nearby capacitor is used to collect the electrons. The build up of charge causes an increase in the voltage across the capacitor. Thus, the capacitor voltage is related to the emission of electrons by the photocathod.
Part 1: Stopping Voltage
As charge builds up on the capacitor, an electric field develops which acts to repel any more electrons from reaching it. Eventually, when enough charge collects on the capacitor, this repelling electric field will be strong enough to completely stop any incoming electrons, and therefore the capacitor will stop charging. On a plot of capacitor voltage versus time (shown below), the stopping voltage is the ‘plateau’.
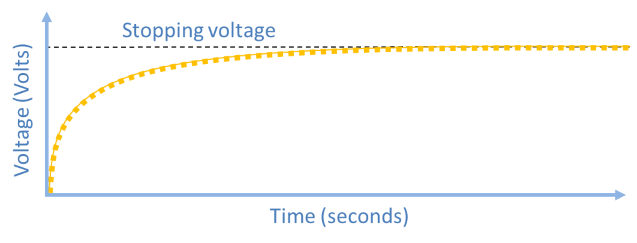
The stopping voltage is the voltage at which no more charge can accumulate on the capacitor.
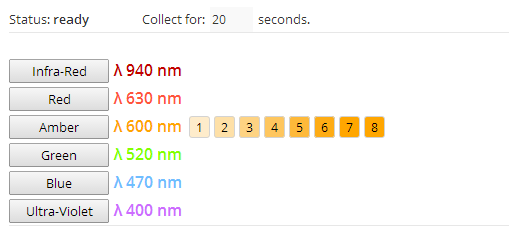
On your experiment interface, to the right of the video, are six buttons which allow you to select which colour, and what intensity, is shining on the photocathode (as in the screenshot below). When you click on an LED button (for example, ‘Amber’) a set of 8 intensity levels will appear. Clicking on an intensity level will tell the equipment to select that LED at the given level of intensity. It will automatically start recording the capacitor voltage as a function of time, and update the chart below the LED controls.
Note: Intensity refers, roughly, to the ‘brightness’ of the light. Higher intensity means more photons, though the energy of each individual photon does not change.
Our goal for now is to see if changing the colour of the light source has any effect on the stopping voltage.
Method:
- In the box labelled ‘Collect for:’, change the value to 60.
- Click on the LED button labelled ‘Infra-Red’, and select intensity level 8.
- Wait for the status label above the LED buttons to change to ‘Ready’.
- Note the maximum voltage that was reached. This is the stopping voltage for this color.
- Repeat steps 2-4 for each of the available colours.
- Download a copy of your data using the Data Browser.
Question:
- Did any colours result in zero voltage being measured?
- Of the colours which did result in measurable voltages, which produced the highest stopping voltage? Which produced the lowest?
Part 2: Work Function and Planck’s Constant
When light hits the photocathode, its energy \(E\) its energy is transferred to an electron in the material. Some of that energy is required to free the electron from the surface of the metal. This energy is called the work function of the metal, and is labelled \(\phi\). When the electron is ejected from the metal, any remaining energy becomes the kinetic energy (\(KE\)) of the electron. The remaining energy is simply:
\mathrm{energy \ remaining} = KE = E \ – \phi
\)E1
When you measure the stopping voltage for a given LED, you are actually measuring the kinetic energy of the ejected electrons. To convert between stopping voltage (\(V_0\)) and kinetic energy, we use the formula:
where \(e\) is the charge of the electron (\(1.602 \times 10^{-19} \ \mathrm{coulombs}\)). Max Planck speculated that light came in small packets of energy, analogous to ‘particles of light’ and now called photons. The energy of a photon depends only on its wavelength. He gave the formula for working out this energy of an individual photon as:
where \(\nu\) is the frequency of the light, and \(h\) is Planck’s constant (\(6.626 \times 10^{-34} \mathrm{m^2 kg \ s^{-1}}\)). Putting equations 1, 2 and 3 together, we can determine the relationship between the wavelength of the light, the stopping voltage, and the work function:
\begin{align}
KE & = V_0 e = h\nu \ – \phi \\
\rightarrow V_0 & = \frac{h}{e} \nu \ – \frac{\phi}{e}
\end{align}
\)E4
We will use this formula, and the data obtained in Part 1, to calculate both the work function of the photocathode, and Planck’s constant.
Method:
- From the data you obtained in Part 1, make a plot of stopping voltage versus the light-source frequency. (The frequency can be calculated from the wavelength using:
\(\nu = \frac{\mathrm{speed \ of \ light}}{\mathrm{wavelength}}\)
- Fit a linear trend line to your data, and write down the fitted coefficients (there is one coefficient for \(x\) and one for the constant term).
- By comparing your coefficients to equation 4, calculate \(h\) and \(\phi\). Note that \(x\) is equivalent to \(\nu\), and the constant term is equivalent to \(\phi/e\).
Question:
- Planck’s constant has been experimentally determined to have a value of \(6.626 \times 10^{-34}\). How close is the value you obtained to the accepted value?
- Compare your value for the work function to those listed in this table. Is your value of the same order of magnitude? Which metal has the closest work function to your value?
Part 3: Light Intensity
Up to now, we have only used the highest intensity of each LED colour when recording data. In this section, we will pick one colour, and record data at varying levels of intensity.
Method:
- In the box labelled ‘Collect for:’, change the value to 20.
- Select the LED labelled ‘Ultra-Violet’.
- Click on intensity level 1, and wait for the data collection to finish.
- Repeat step 3 for intensity levels 3, 5 and 8.
- Download a copy of your data using the Data Browser.
Question:
- Does varying the intensity affect the time taken to reach the stopping voltage?
- Does the time taken to reach the stopping voltage increase or decrease as you increase the intensity?