
Experimental stations
Coming soon!
Introduction
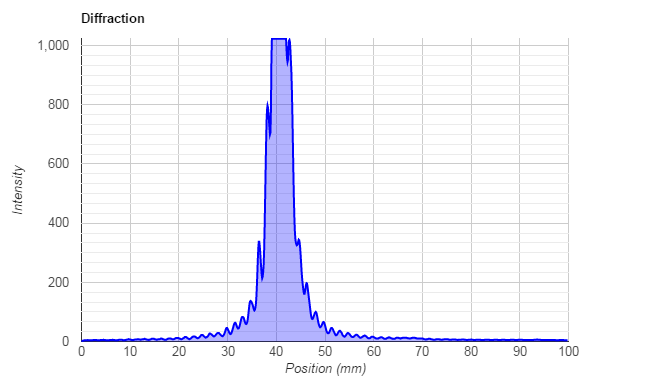
The laser hair diffraction experiment allows us to determine widths of small objects through the use of a recorded light intensity profile which shows how light is interfering at different locations. This information can be used in addition to other known values to determine the width of the wire.
When the light strikes the wire, the light emerging from either side of the wire emits waves as if being emitted from a point source. These point sources emit the now diffracted light, in addition with any light not diffracted by the wire. The waves will add together and be recorded at the viewing screen, where the interference of the waves will depend on their phase shifts and intensities.
To investigate this phenomena, you will be using the following pieces of equipment.
-
Laser source:Known wavelength value
-
Sliding detector: Known distance from copper wire, gives the light intensity profile in mm separation(ensure conversion to meters)
- Copper wire:Cause the diffraction effects to occur which gives rise to the intensity profile
When the laser is activated some of the light will undergo diffraction upon encountering the copper wire, this will lead to the diffraction pattern that is observed/detected.
PART 1 Getting the light intensity profile
Once the laser shines on the copper wire the diffraction pattern is already present on the viewing screen. All that needs to be done is to have the detector scan the viewing screen for the light intensity profile.
METHOD:
- Access your station
- Click ‘Start Scan’
- Above your graph click ‘Make PNG’
Questions:
- Which peak do you believe to be the central maximum, and why?
Your light intensity profile of the diffraction pattern will show peaks and troughs. Peaks are due to constructive light interference. Troughs are due to destructive light interference, these troughs will be quite low.
PART 2 FINDING YOUR FRINGES
METHOD:
- Locate the highest peak and label it the central maximum with a fringe order number of m = 0. Everything to the left of m = 0 is negative and everything to the right of m = 0 is positive.
- Locate the next peak on the left and right side of the central maximum label these fringes m = 1 and -1 as per step 1
- Measure the distance from the center of the m = 1, -1 along the x-axis from m = 0 as per step 1
- Repeat this process for fringes m = 2, -2 and m = 3, -3.
- Locate the first trough on the left and right side of the central maximum and label these fringes m = 1/2, -1/2, as per step 1
- Measure the distance from the center of the fringes m = 1/2, -1/2 along the x-axis to the center of the m = 0 peak as per step 1
- Repeat this process for fringes m = 3/2, -3/2 and m = 5/2, -5/2
Questions:
- Do fringes of the same m value have the same measured distance from the central maximum?
- What do you notice about the intensity of the peaks as you get further from the central maximum?
PART 3 FINDING WIDTH
METHOD:
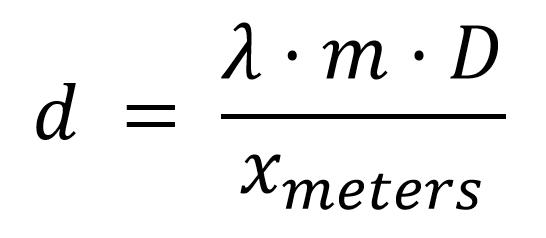
- From the data given in part one convert all the measurements λ, D and xmeters to meters.
- Input all your values in the table below.
- Calculate d for each row of values in the table.
- Average out the determined values for d to determine the final value for d
Questions:
- The diameter of the copper wire is (INSERT VALUE). How close is the value you obtained to the accepted value?