
Coming Soon
Monitor a Functioning Solar Hot Water System
The hot water tank has been fitted with 18 tiny thermometers to measure the temperature at particular places, as can be seen in the experiment interface. These are called "sensors". These sensors are labelled from T1-T18. Sensor T20 measures the outside (ambient) temperature, while T19 measures the temperature in the hot water outlet pipe (which is often closed, so T19 temperatures are usually similar to T20). Each sensor records the temperature every 5 seconds. To plot the data from a particular sensor, first select the date and time that you wish to plot, select the sensor(s) for plotting and then press "plot data".
Part 1: Heating and cooling of the water
Method:
- Choose a 24-hour time period to study for a particular day, and one temperature sensor (T1-T18).
- Create a plot of temperature for your chosen sensor and time interval. Also plot the data for sensor T20.
Questions:
- What happens to the temperature of the water and outside air over the 24-hour time period?
- What is the difference between the maximum and minimum water temperature?
- What is the difference between the maximum and minimum air temperature?
Part 2: Heat distribution inside the tank
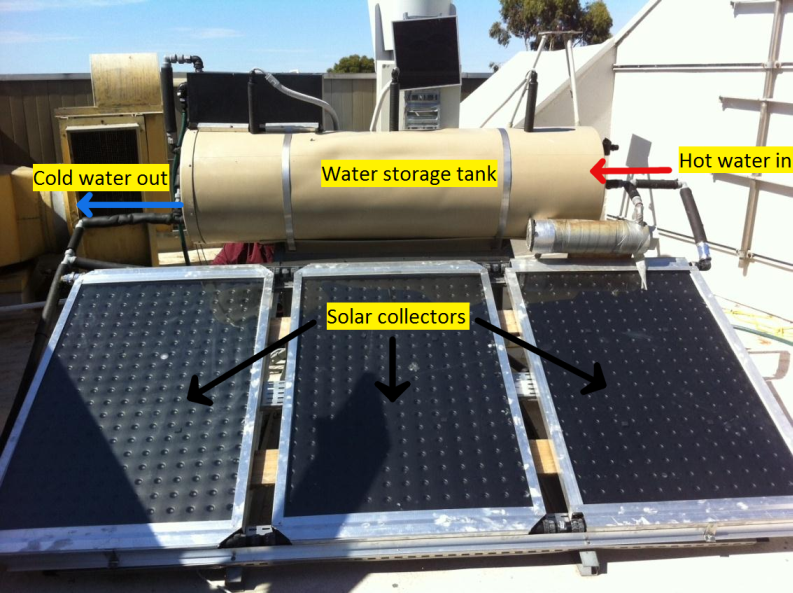
Due to the movement of water between the tank and the collector panel, different parts of the tank are at different temperatures. Warm water from the solar panels enters the tank from the right and leaves from the left (see picture below right). Inside the tank, warm water rises and cool water sinks. We will now find out which parts of the tank have the coolest water and which parts have the warmest water.
Method:
- Choose a 24-hour time period to study.
- Plot the temperature data for as many sensors T1-T18 as you like, over this period.
 Click to enlarge
Questions:
- Which part of the tank contains the warmest water?
- Which part of the tank contains the coolest water?
- Which temperature sensor has the coolest temperature?
Part 3: Monitoring the solar hot-water heater for Legionella growth
To monitor the system for the possible growth of Legionella bacteria, you will need temperature data for a 7-day period. Legionella bacteria, which can be very dangerous to people, can only grow at a certain temperature. For the water to be safe it must meet one of the conditions shown in the table below, at least once in the 7-day period.
| Temperature (°C) | Time required |
| 70 or more | 1 second |
| 66 | 2 minutes |
| 60 | 32 minutes |
| 55 | 6 hours |
For example, the water will be safe if, over the last 7 days, it was at least 60°C for 32 minutes in a row. OR, the water will be safe if it got to at least 70°C, any time in the 7-day period.
Method:
- Choose a 7-day period when you expect the outside temperature to be quite warm.
- Plot the data for the temperature sensor that is located in the coldest part of the tank (use your answer from Part 2).
- Repeat step 2 for another 7-day period when you expect the outside temperature to be quite cold.
Questions:
- At the end of each 7-day period, was the water safe to use? If yes, which temperature conditions from the table above were satisfied?